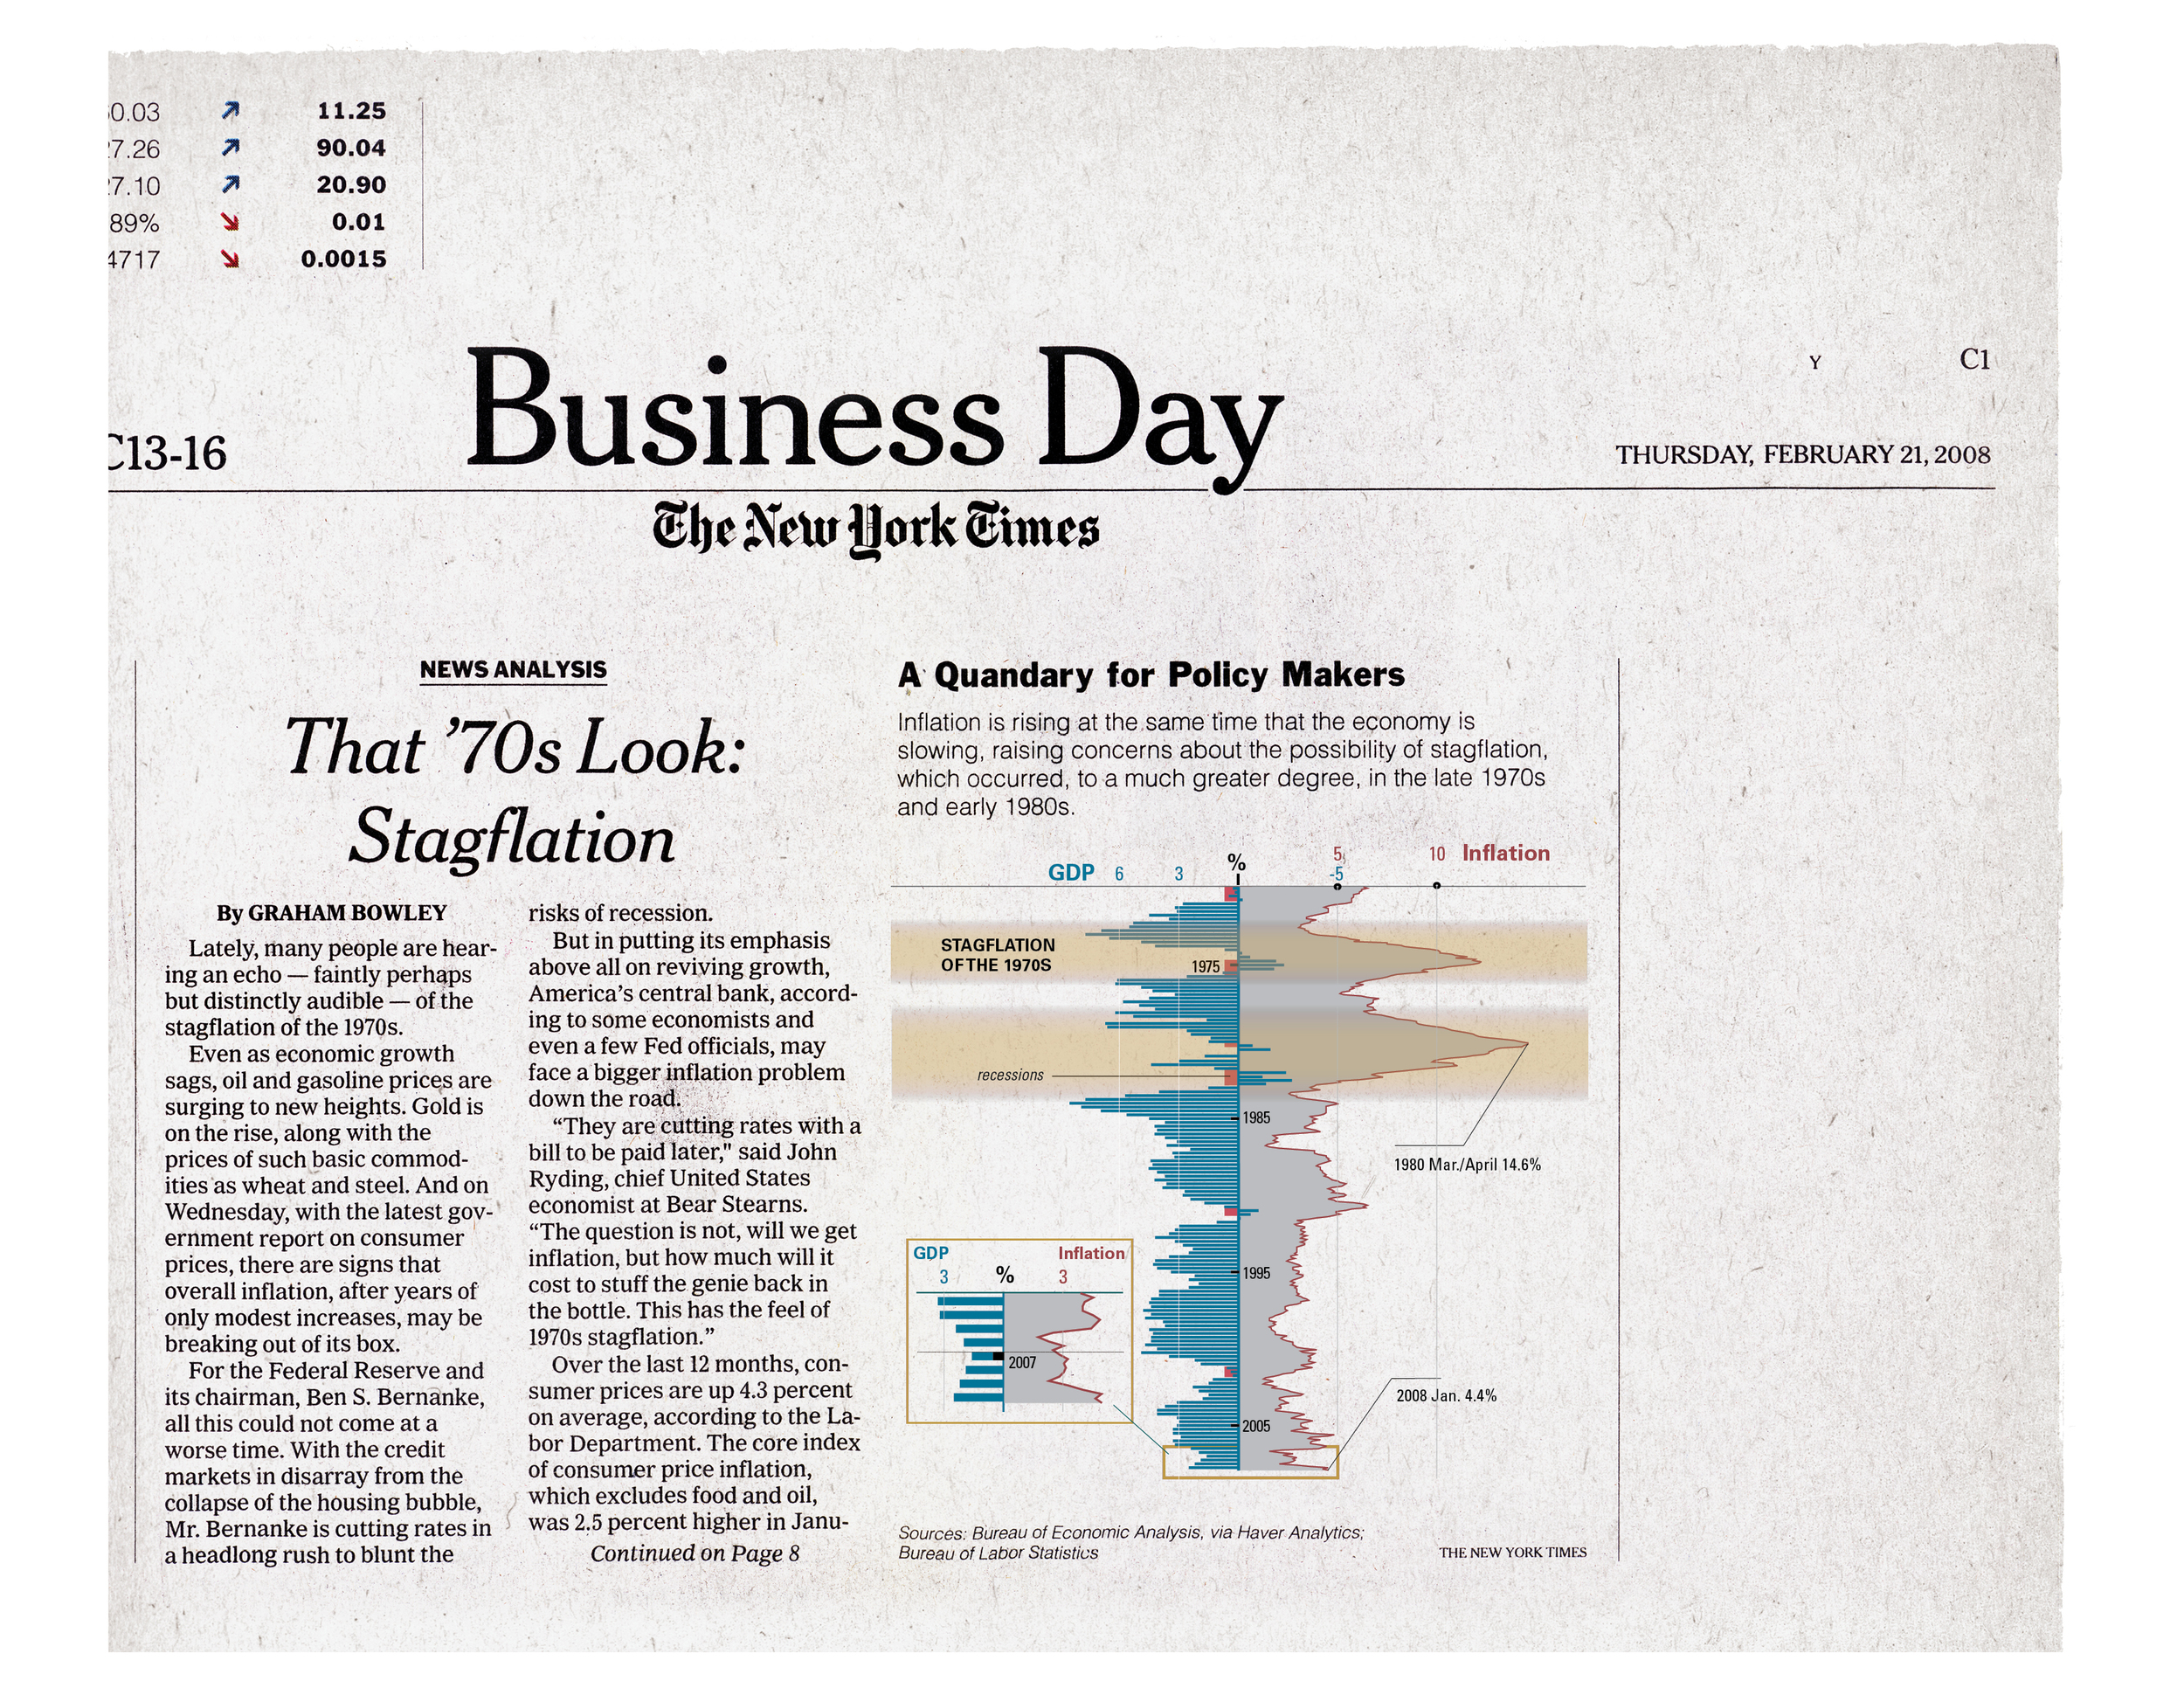
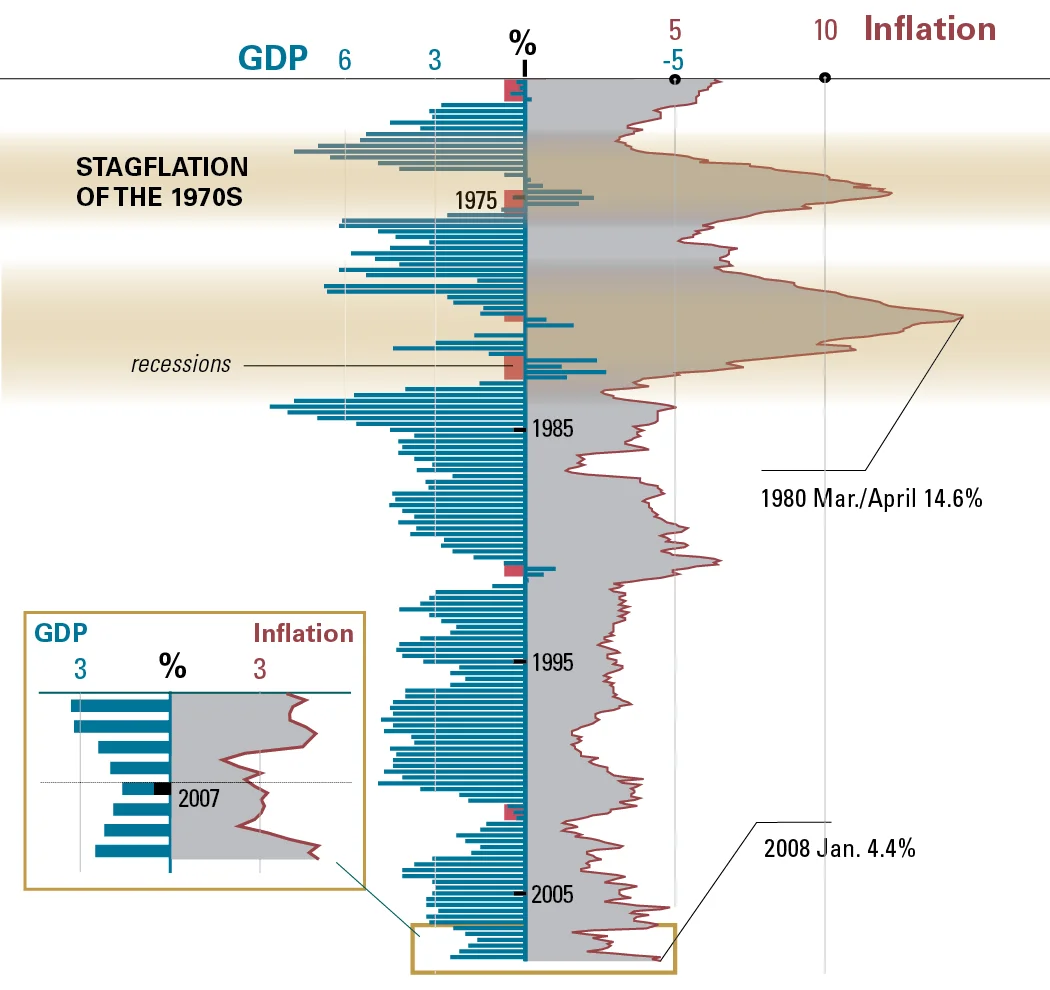
That '70s Look: Stagflation
This data plot project aims to support and express a The New York Times article from 2008 graphically.
This specific graph aims to show the stagflation of the 1970s, the relationship of GDP and inflation from 1970 to 2008, and to indicate the future trend about whether there is a stagflation similar to that of the 70's coming soon?
#graphicdesign #datavisualization
2015.10